

CensusScope is a product of the Social Science Data Analysis Network.
United States |
Print-Friendly Version |
ABOUT DISSIMILARITY INDICES
The dissimilarity index is the most commonly used measure of segregation between two groups, reflecting their relative distributions across neighborhoods within the same city (or metropolitan area). In this study displayed on CensusScope.org, neighborhood areas are defined as block groups (link) (with average populations of 1000) based on data from the 2000 Census. Unlike the exposure index (link), which measures a single group's average exposure to all other groups, the dissimilarity index is always a comparison between two groups, and measures their relative separation (high dissimilarity) or integration (low dissimilarity) across all neighborhoods in the city or metropolitan area.
The dissimilarity index varies between 0 and 100, and measures the percentage of one group that would have to move across neighborhoods to be distributed the same way as the second group. (It is a symmetrical measure so that this interpretation can apply to either group). A dissimilarity index of 0 indicates conditions of total integration under which both groups are distributed in the same proportions across all neighborhoods. A dissimilarity index of 100 indicates conditions of total segregation such that the members of one group are located in completely different neighborhoods than the second group. Neither extreme value is generally seen in most cities and metropolitan areas. Rather the value typically lies somewhere in-between 0 and 100.
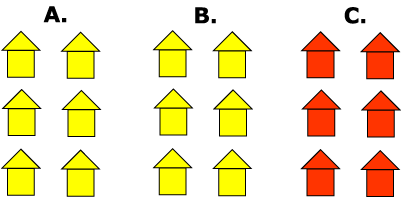
In a simple example, lets assume there are only three neighborhoods in a metropolitan area with 1200 whites and 600 blacks. If one dot represents 100 people and yellow and red dots represent white and black people, respectively, the following situation depicts complete segregation, or a dissimilarity index of 100:

This represents a scenario of complete segregation because all 1200 whites reside in Blocks A and B, and all 600 blacks reside in Block C. Here, the dissimilarity index is 100 because 100% of the 600 blacks would have to move to be distributed like the 1200 whites. In this case, 300 blacks would move to block A and 300 blacks would move to block B. As a result, both blacks and whites would be distributed the same way: half of all blacks would be located in each Blocks A and B; and half of all whites would be located in Blocks A and B. (Alternatively, the blacks could stay where they were, and all whites could move to Block C so that there would again be a similar distribution of both races).
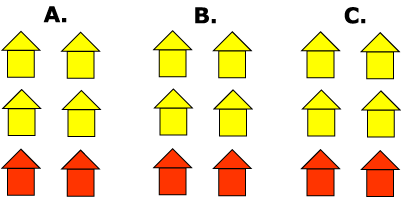
A scenario of complete integration would be:

In this case, the 600 blacks are equally distributed across the three blocks, with a third (200 blacks) located in each. Similarly the 1200 whites are equally distributed with a third (400 whites) located in each. No black or white would need to relocate to make the distribution any more equal. Here the segregation index is 0.
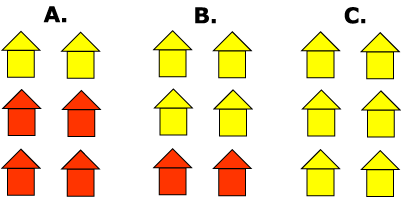
However, the more usual situation lies somewhere in-between complete segregation and complete integration. The following represents such an example:

In this case, the segregation index is 50. That is because it would be necessary for either half the blacks or half the whites to change neighborhoods to be distributed like the other group. In the case of blacks, 300 (50% of all blacks) would have to move out of Block A with 100 going to Block B and 200 going to Block C. As a result, both Blacks and Whites would have one-sixth of their populatons in Block A, two-sixth of their populations in Block B, and three sixth of their populations in Block C. Alternatively, similar black-white distributions could be achieved by the movement of whites. In this case, the 600 whites in Block C (50% of all whites) would have to move to Block A. As a result, both blacks and whites would have two thirds of their populations in Block A and one third of their populations in Block B, again achieving the same distributions.
It should be noted that the dissimilarity index can range from 0 to 100 irrespective of the relative sizes of each group. In the above example there were 1200 whites and 600 blacks. However, these sizes could be reversed (or even take on completely different values) and it would still be possible to achieve dissimilarity values ranging from 0 to 100. This is because the dissimilarity index only measures the relative distribution of each group across neighborhoods, (ie. are they distributed similarly or differently?). The measure does not reflect the relative sizes of each group in a given neighborhood, or in an average neighborhood. The latter is measured by the Exposure Index (link).
Dissimilarity Index formula:
The formula used to calculate the dissimilarity index for two race and ethnic groups within the same city (or metropolitan area) is as follows:

where P1 = city -wide population of Group 1
P2 = city -wide population of Group 2
P1i = neighborhood i population of Group 1
P2i = neighborhood i population of Group 2
n = number of neighborhoods in city